Turning AI analytics into decisions, not just dashboards.
AI admins could see how their assistants and agents were performing, but nothing told them what mattered or what to do next. I'm designing AI Analytics to close that gap: from a wall of charts to a ranked decision, a clear root cause, an action and a record that it worked.
The problem
Knowing AI is working isn't the same as knowing whether it's working well, why, or what to do next.
AI Analytics started as consolidation: bring assistant, agent and admin analytics under one roof. That produced an accurate but inert product. The old overview showed "161 AI-assisted actions" and a chart of six unranked assistant lines, with nothing saying whether 161 was good or what to do about it. Reaching any chart took four steps, and an audit found the same date filter repeated on six charts on one page. The product had grown by addition rather than by design.
- Manual by design. Every insight needed a person to notice it, judge it and explain it.
- Limited reach. Only admins had access, so practitioners and leaders relied on screenshots and spreadsheets.
- Divided experience. Assistant, agent and admin analytics lived apart, so questions that crossed them couldn't be answered.
What we learned
Research across admins, practitioners and analytics leads kept pointing at the same thing: people don't want more charts, they want to know what to act on, and they need to trust the number before they act.
- Three different triggers, one screen. People came for a scheduled review, a system alert or a stakeholder request, yet every visit started from the same dashboard.
- Trust comes before action. A customer warned that an unexplained "deflection rate" leads executives to conclude they can cut staff, and then lose trust in the numbers altogether.
- People delegate execution, not judgment. They were happy for AI to do the work, but wanted to own the decision.
"Can't access data? No analysis. Can't trust the data? No action."
Logistics manager, research participant
Who it's for
- AI admin (primary). Closest to the data, owns the AI assets, spends the most time hunting for problems.
- AI practitioner. Needs organisation-wide health and productivity, translated into value.
- Operations leader. Needs numbers they can trust and present to others.
The vision
Analytics that does something with information, not just shows it.
I framed the product around one mental model, from raw data to a finished action, and five principles: insight first, not dashboard first · reduce cognitive load · guide, don't just show · make actions obvious · relevance over completeness.
- One home, organised by intent. Overview, usage, adoption, sentiment, self-solve performance and assists, instead of separate tools per asset type.
- A curated hero row. Six metrics with direction and trend, so the first glance says what changed.
- Fleet view and object view. See all assistants and agents at once, then drill into one, down to an individual conversation or an agent's reasoning trace.
- Access by role, not admin only, so practitioners and leaders stop working from screenshots.
Closing the loop 🏆
Incidents have a status. Decisions don't.
Even with good insights, nothing owned what happened next. A KPI could drop, the signal could be on screen, and nobody would act. So the next layer turns a signal into an owned decision: who should act, on what first, why it happened, what to do, and whether it worked. Otto, ServiceNow's AI assistant, guides the admin through it, and the admin stays in charge of every decision.
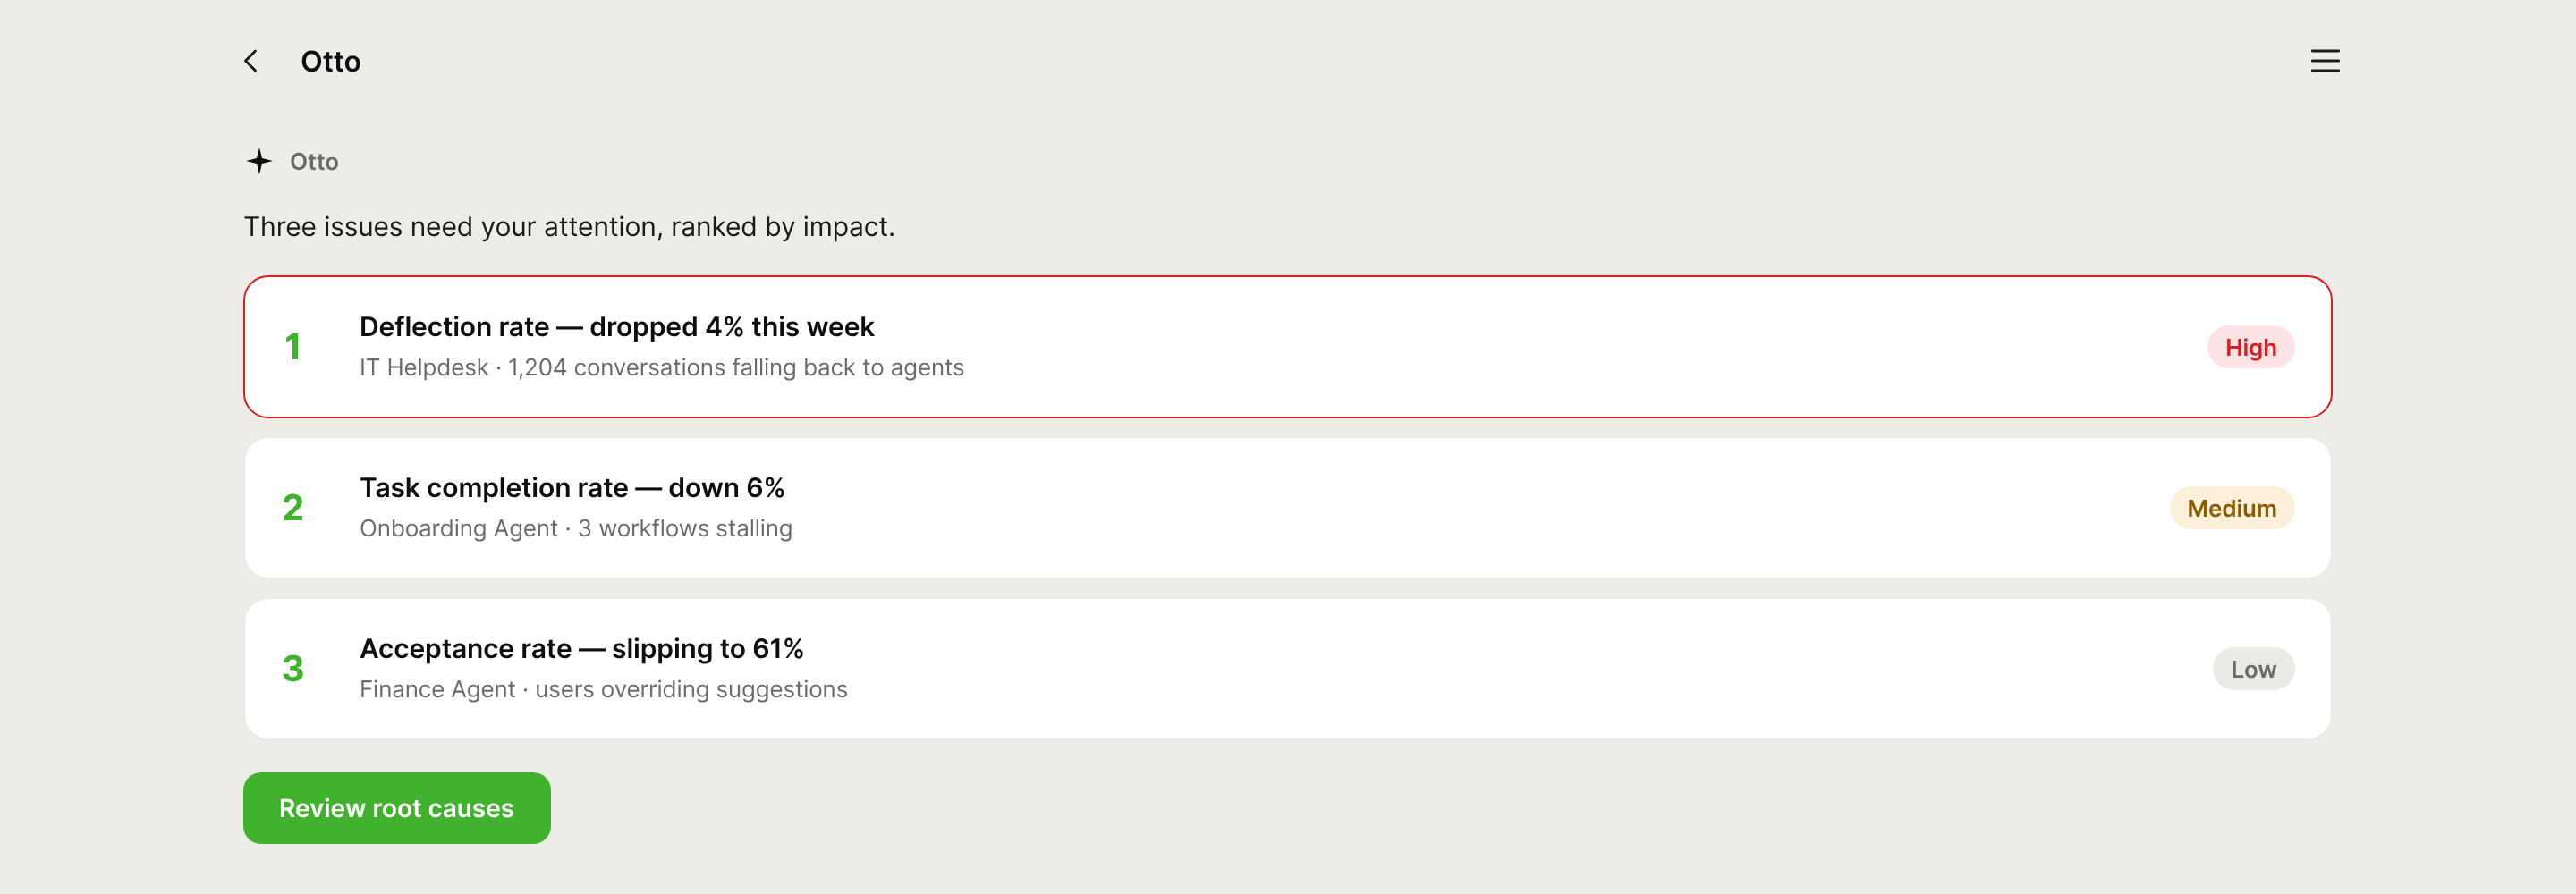
Start with what matters most
Issues are ranked by impact, so the admin sees one clear first decision instead of forty charts. Ranking across KPIs is kept separate from ranking causes within one KPI.
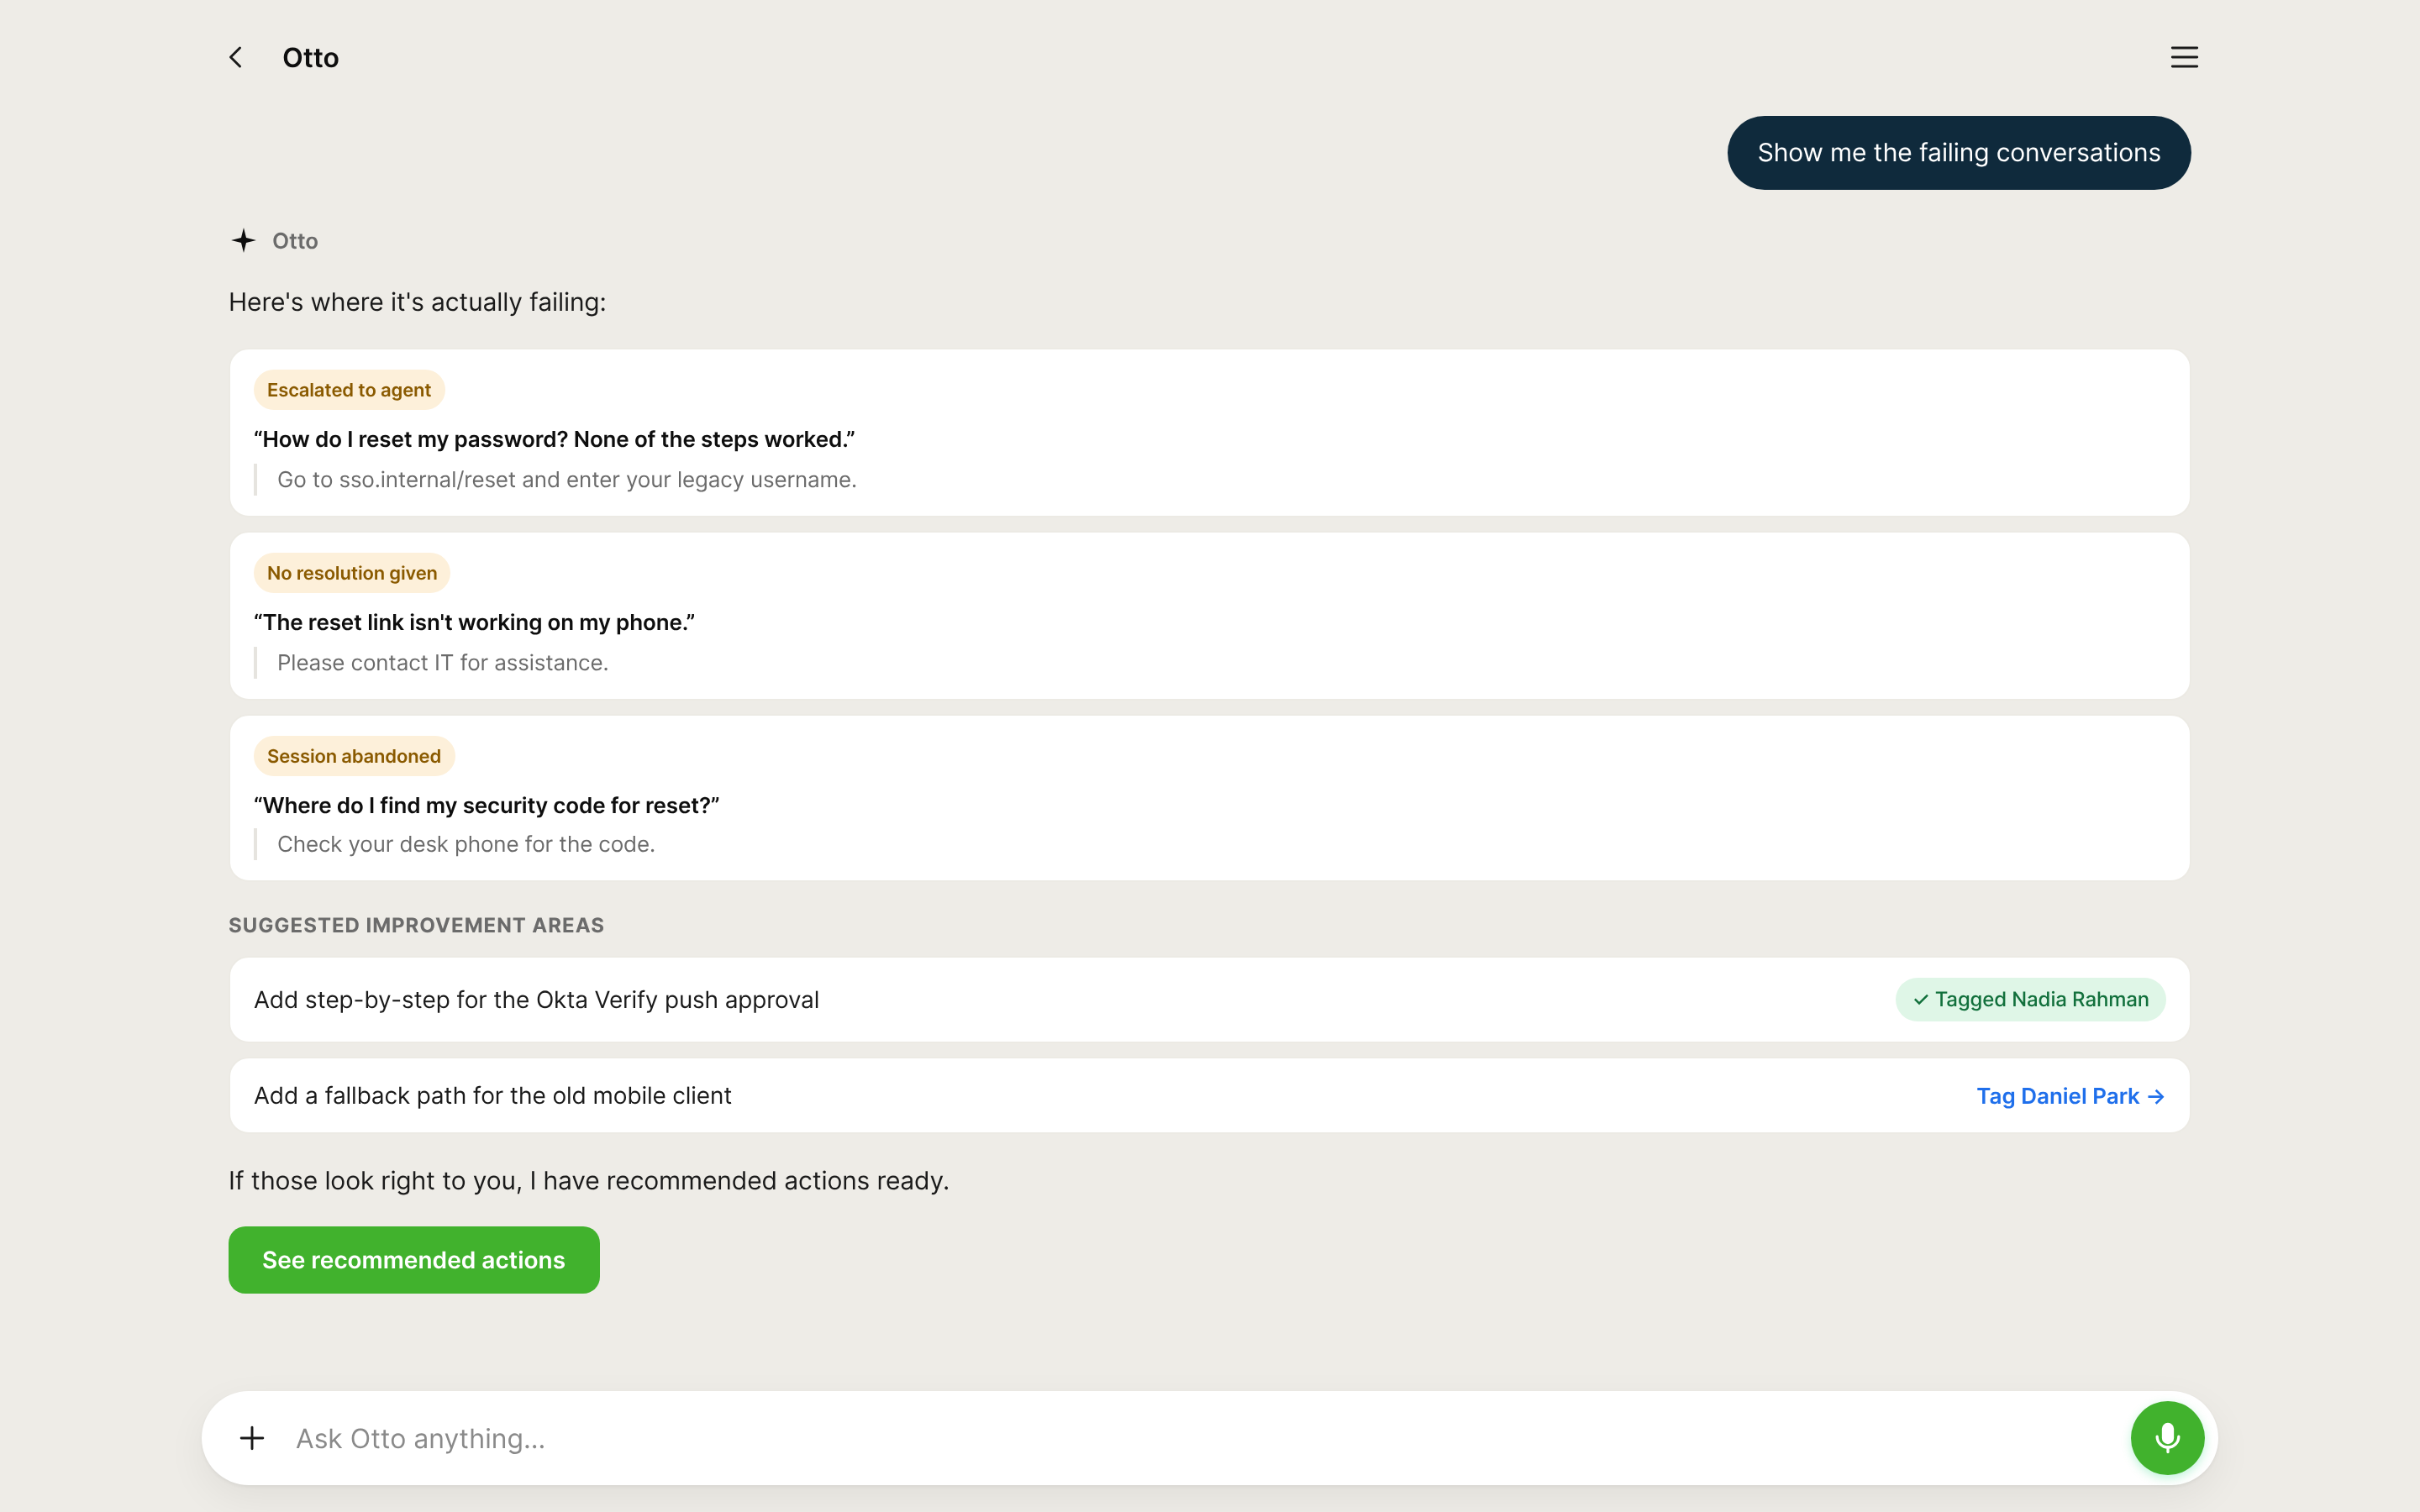
Show the cause, with evidence
The likely root cause comes first, backed by the actual failing conversations. Otto suggests what to improve, and the admin can tag the right owner to fix the content while keeping the decision.
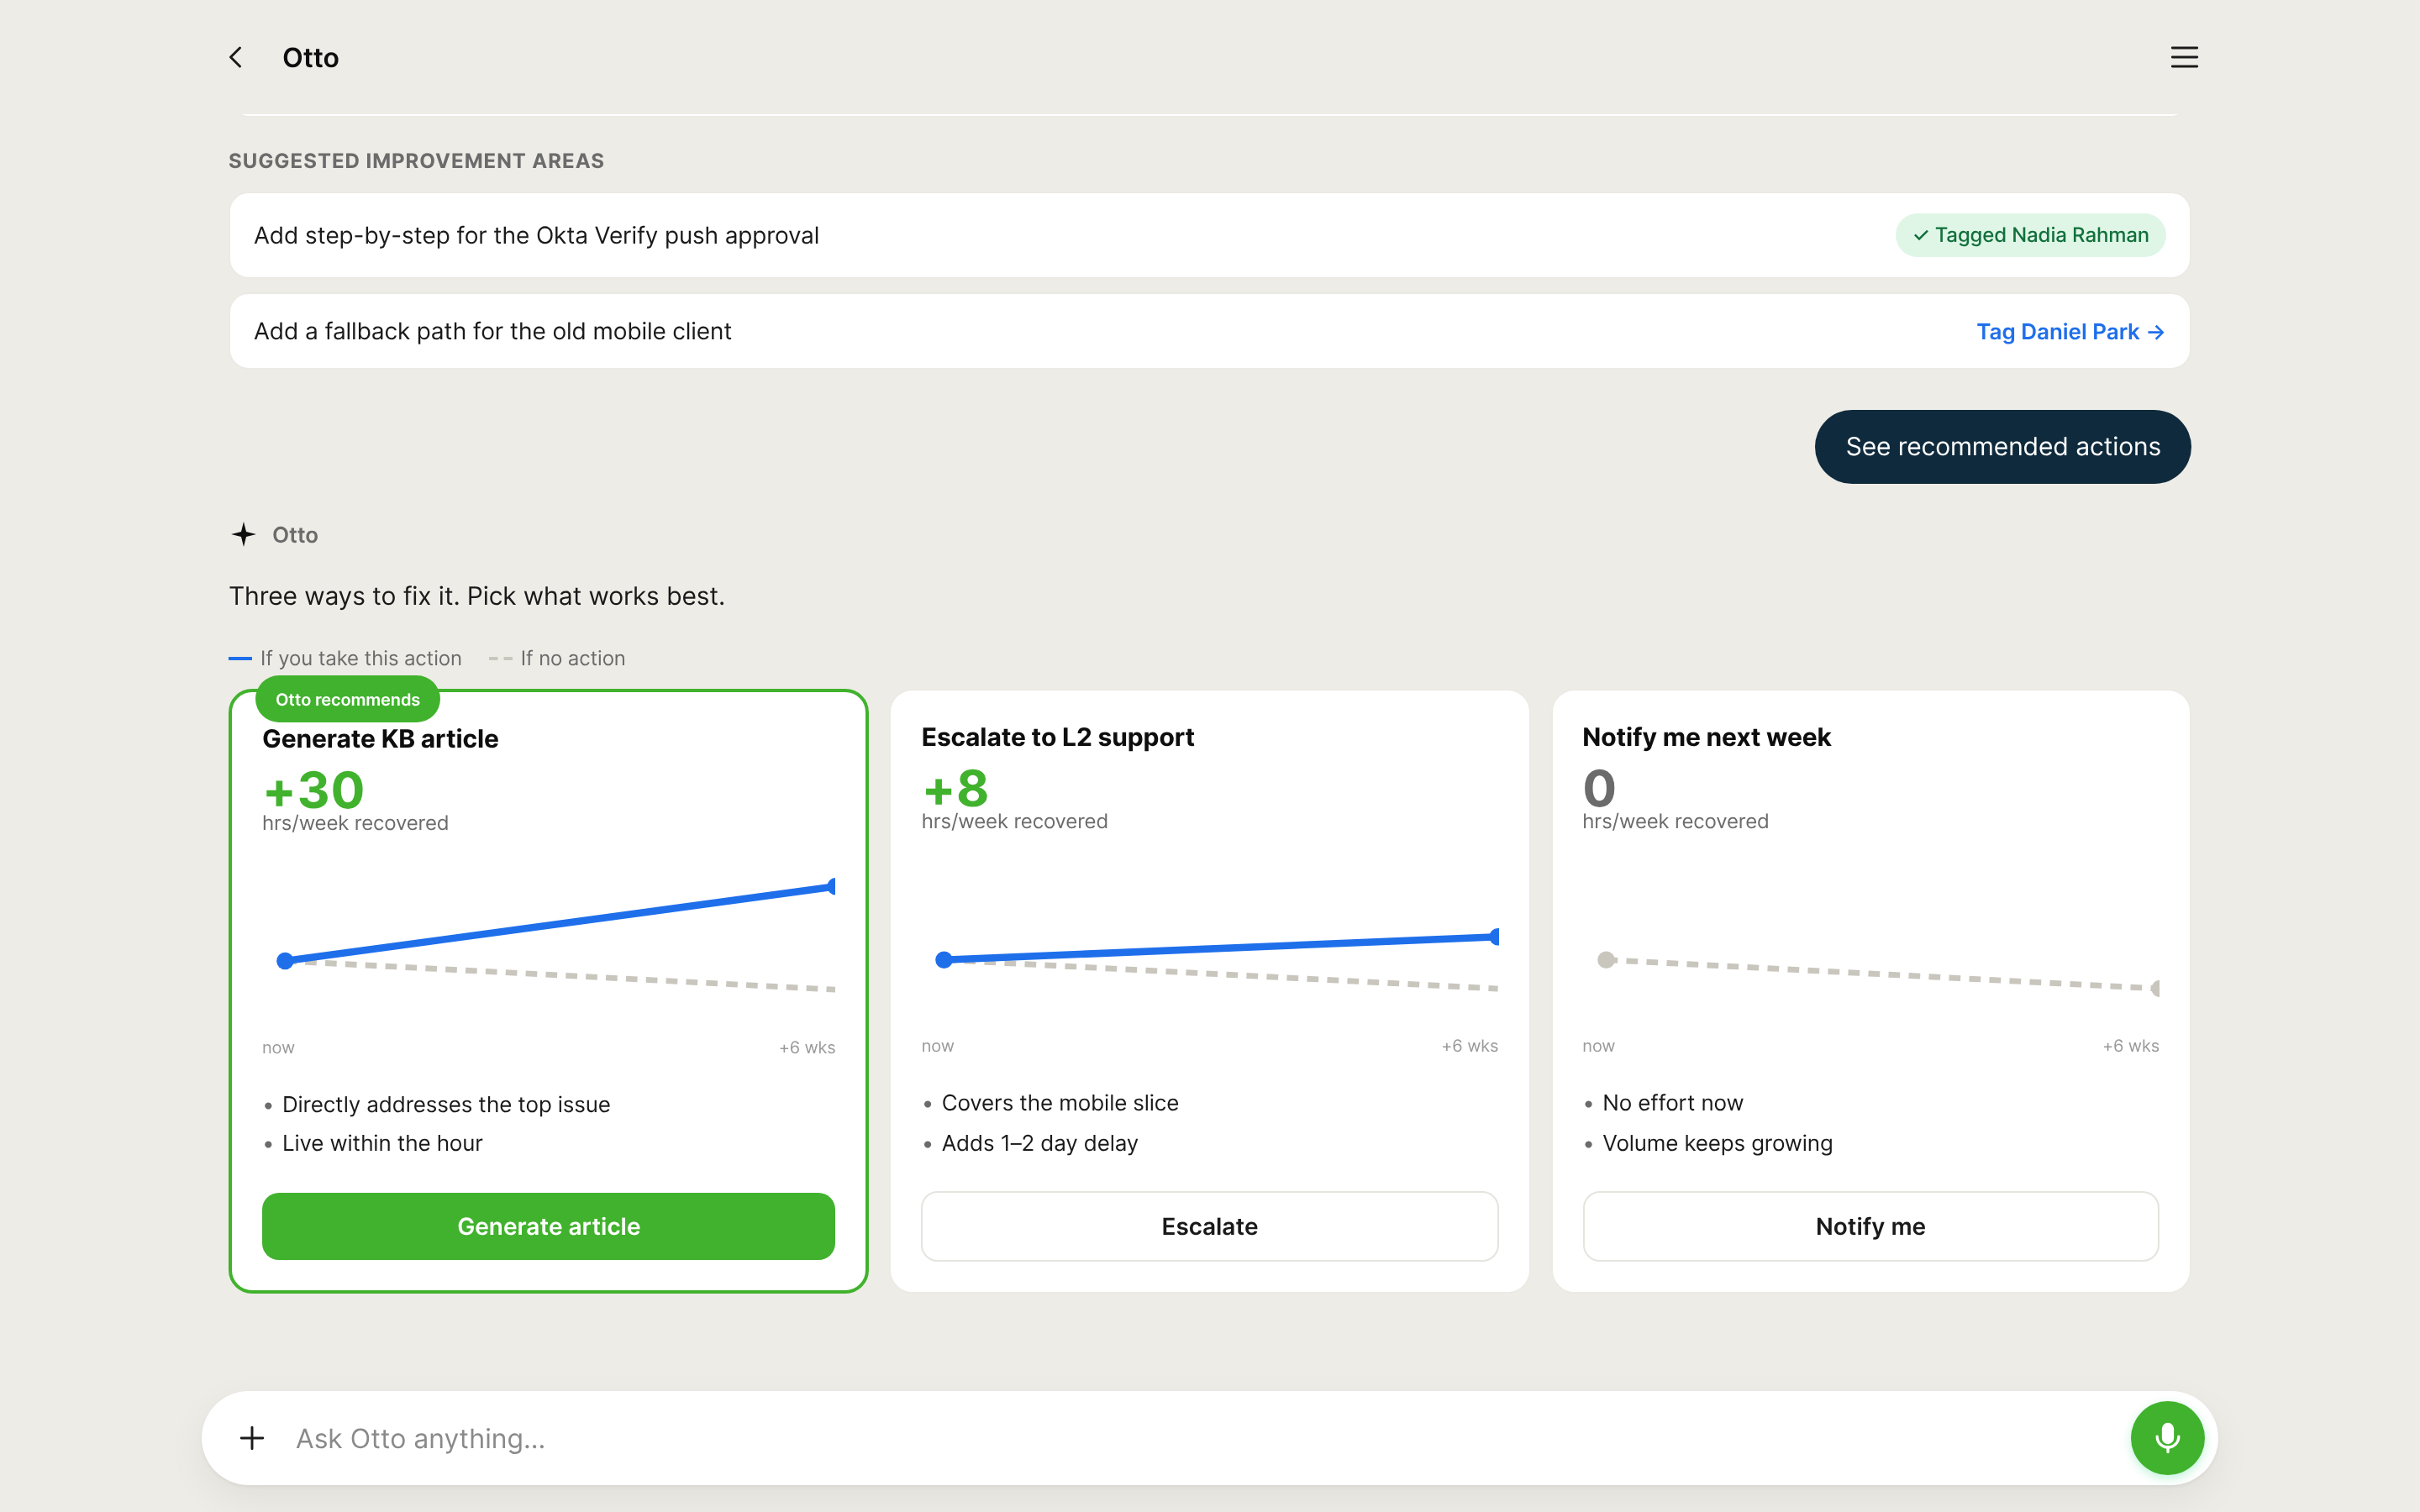
Compare actions by their impact
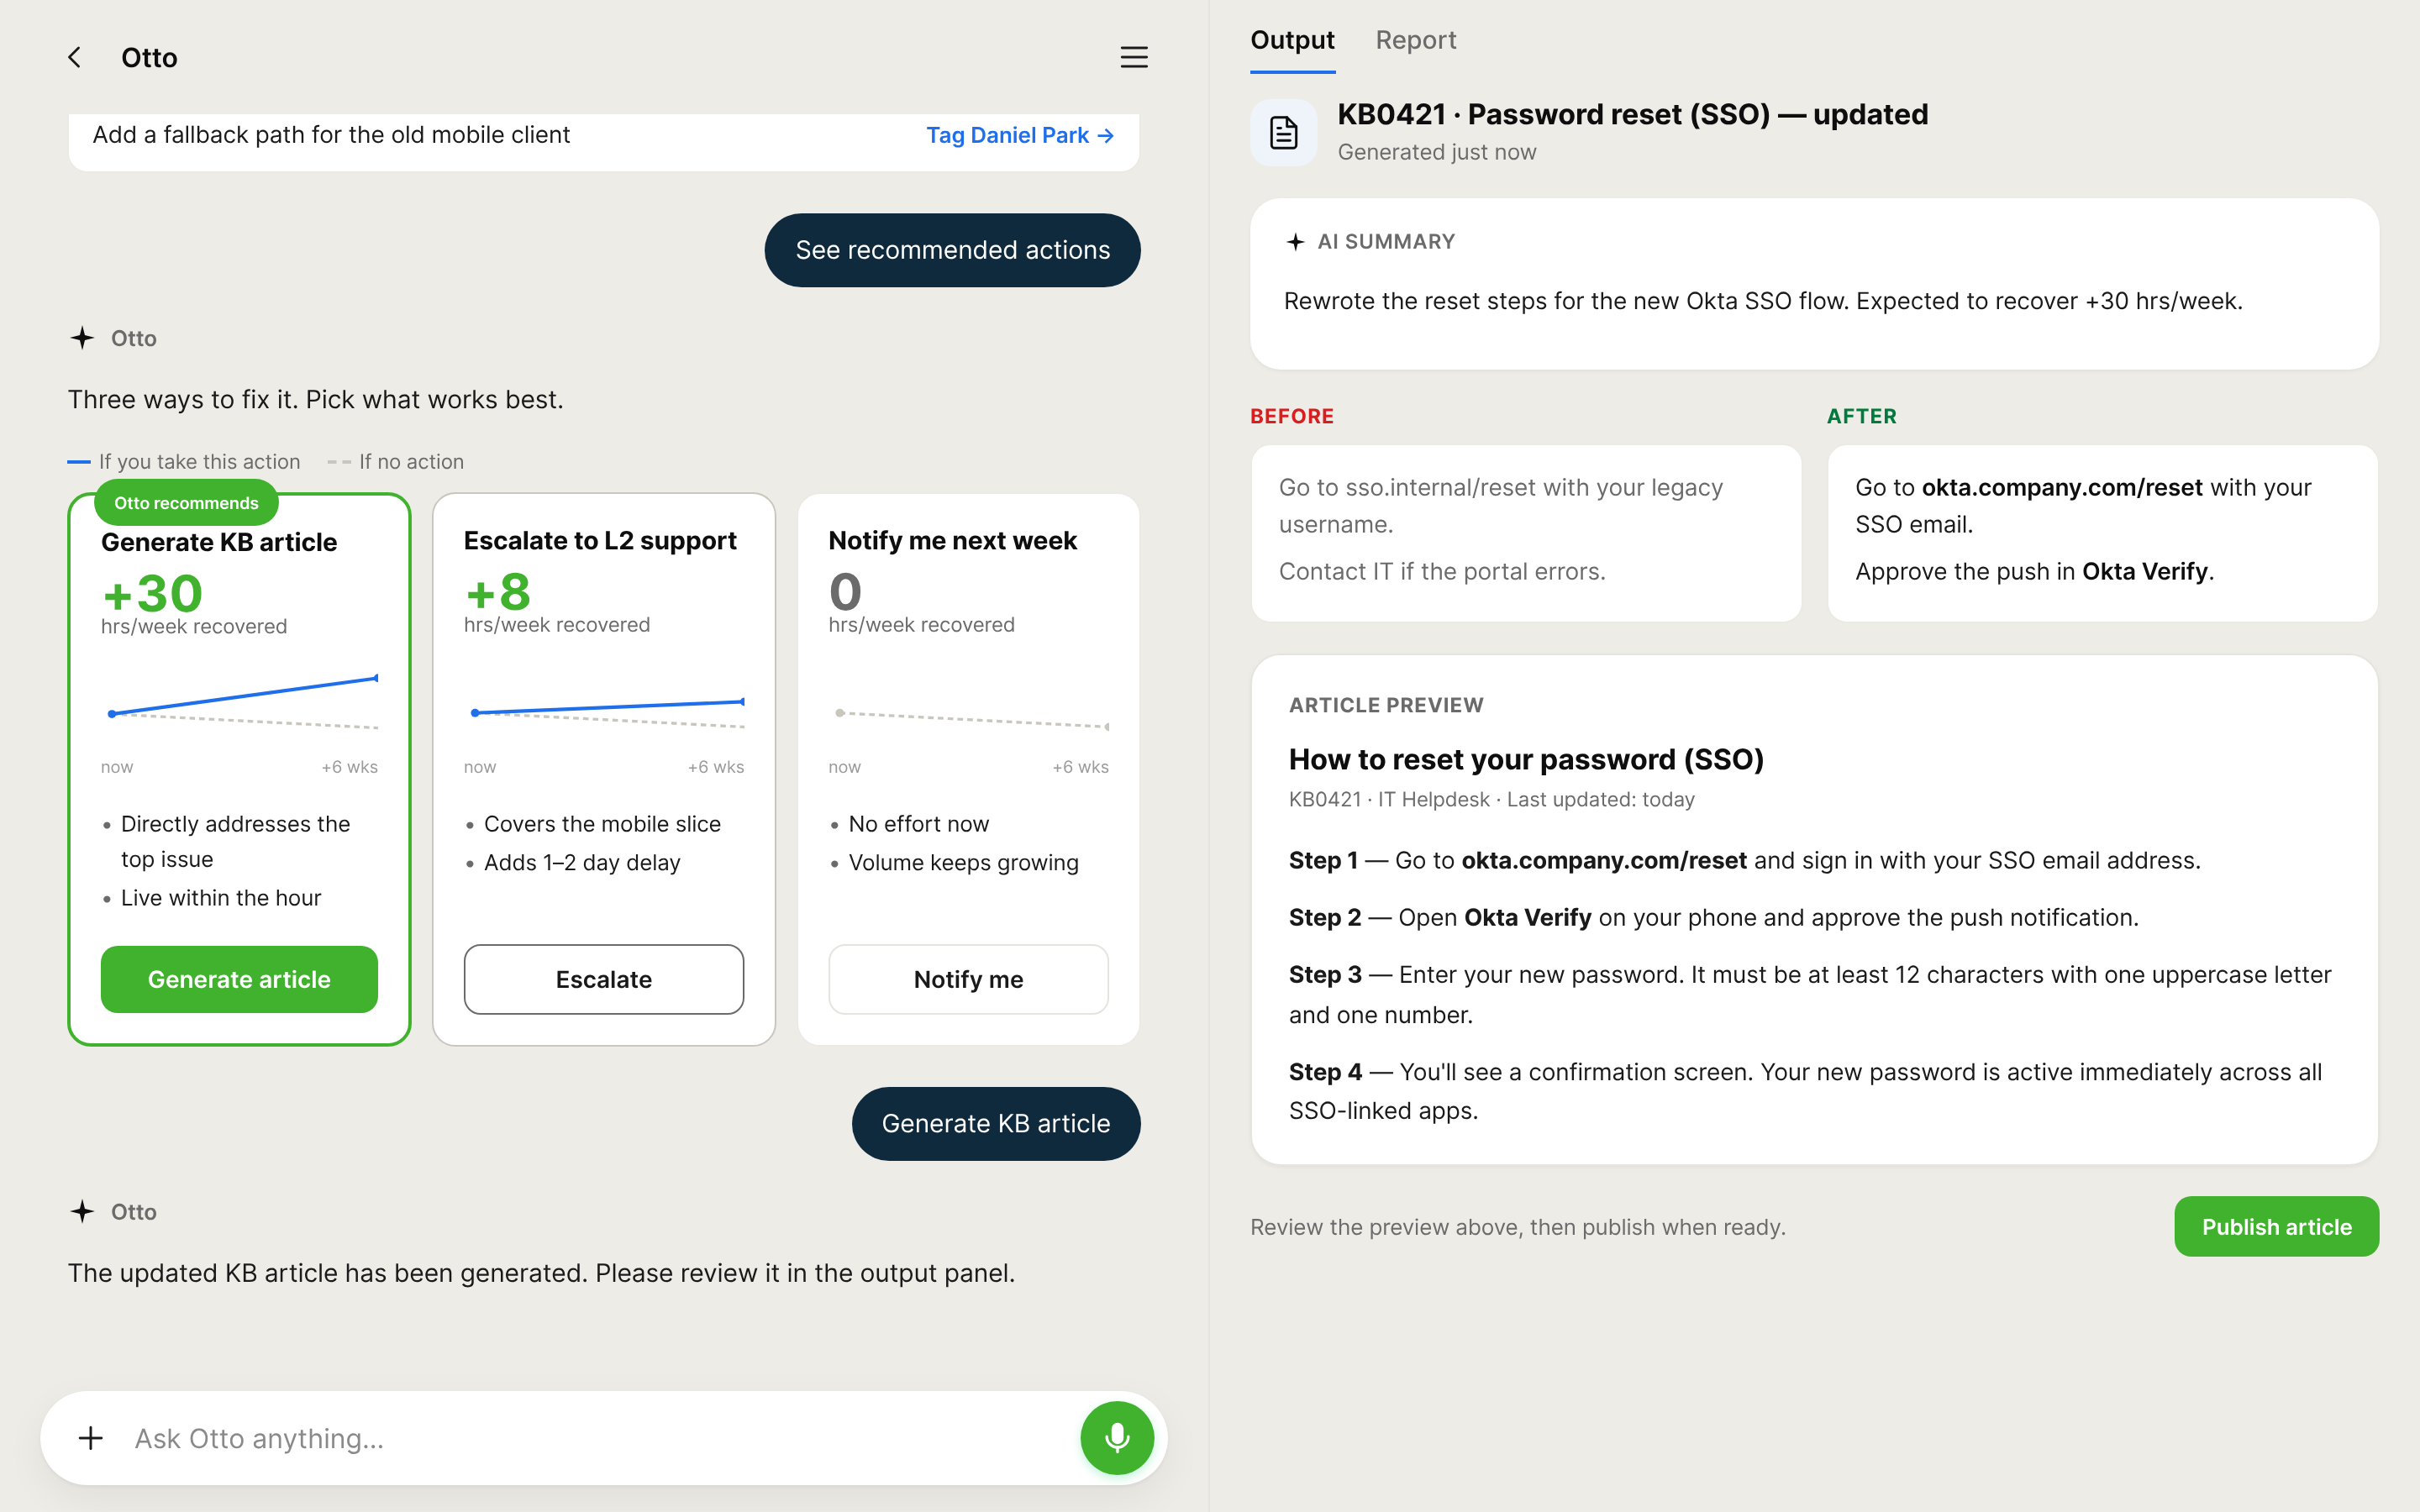
Three options, each with its projected recovery against doing nothing, so the trade-off is visible at a glance. Otto recommends one, but doing nothing is always an explicit choice.
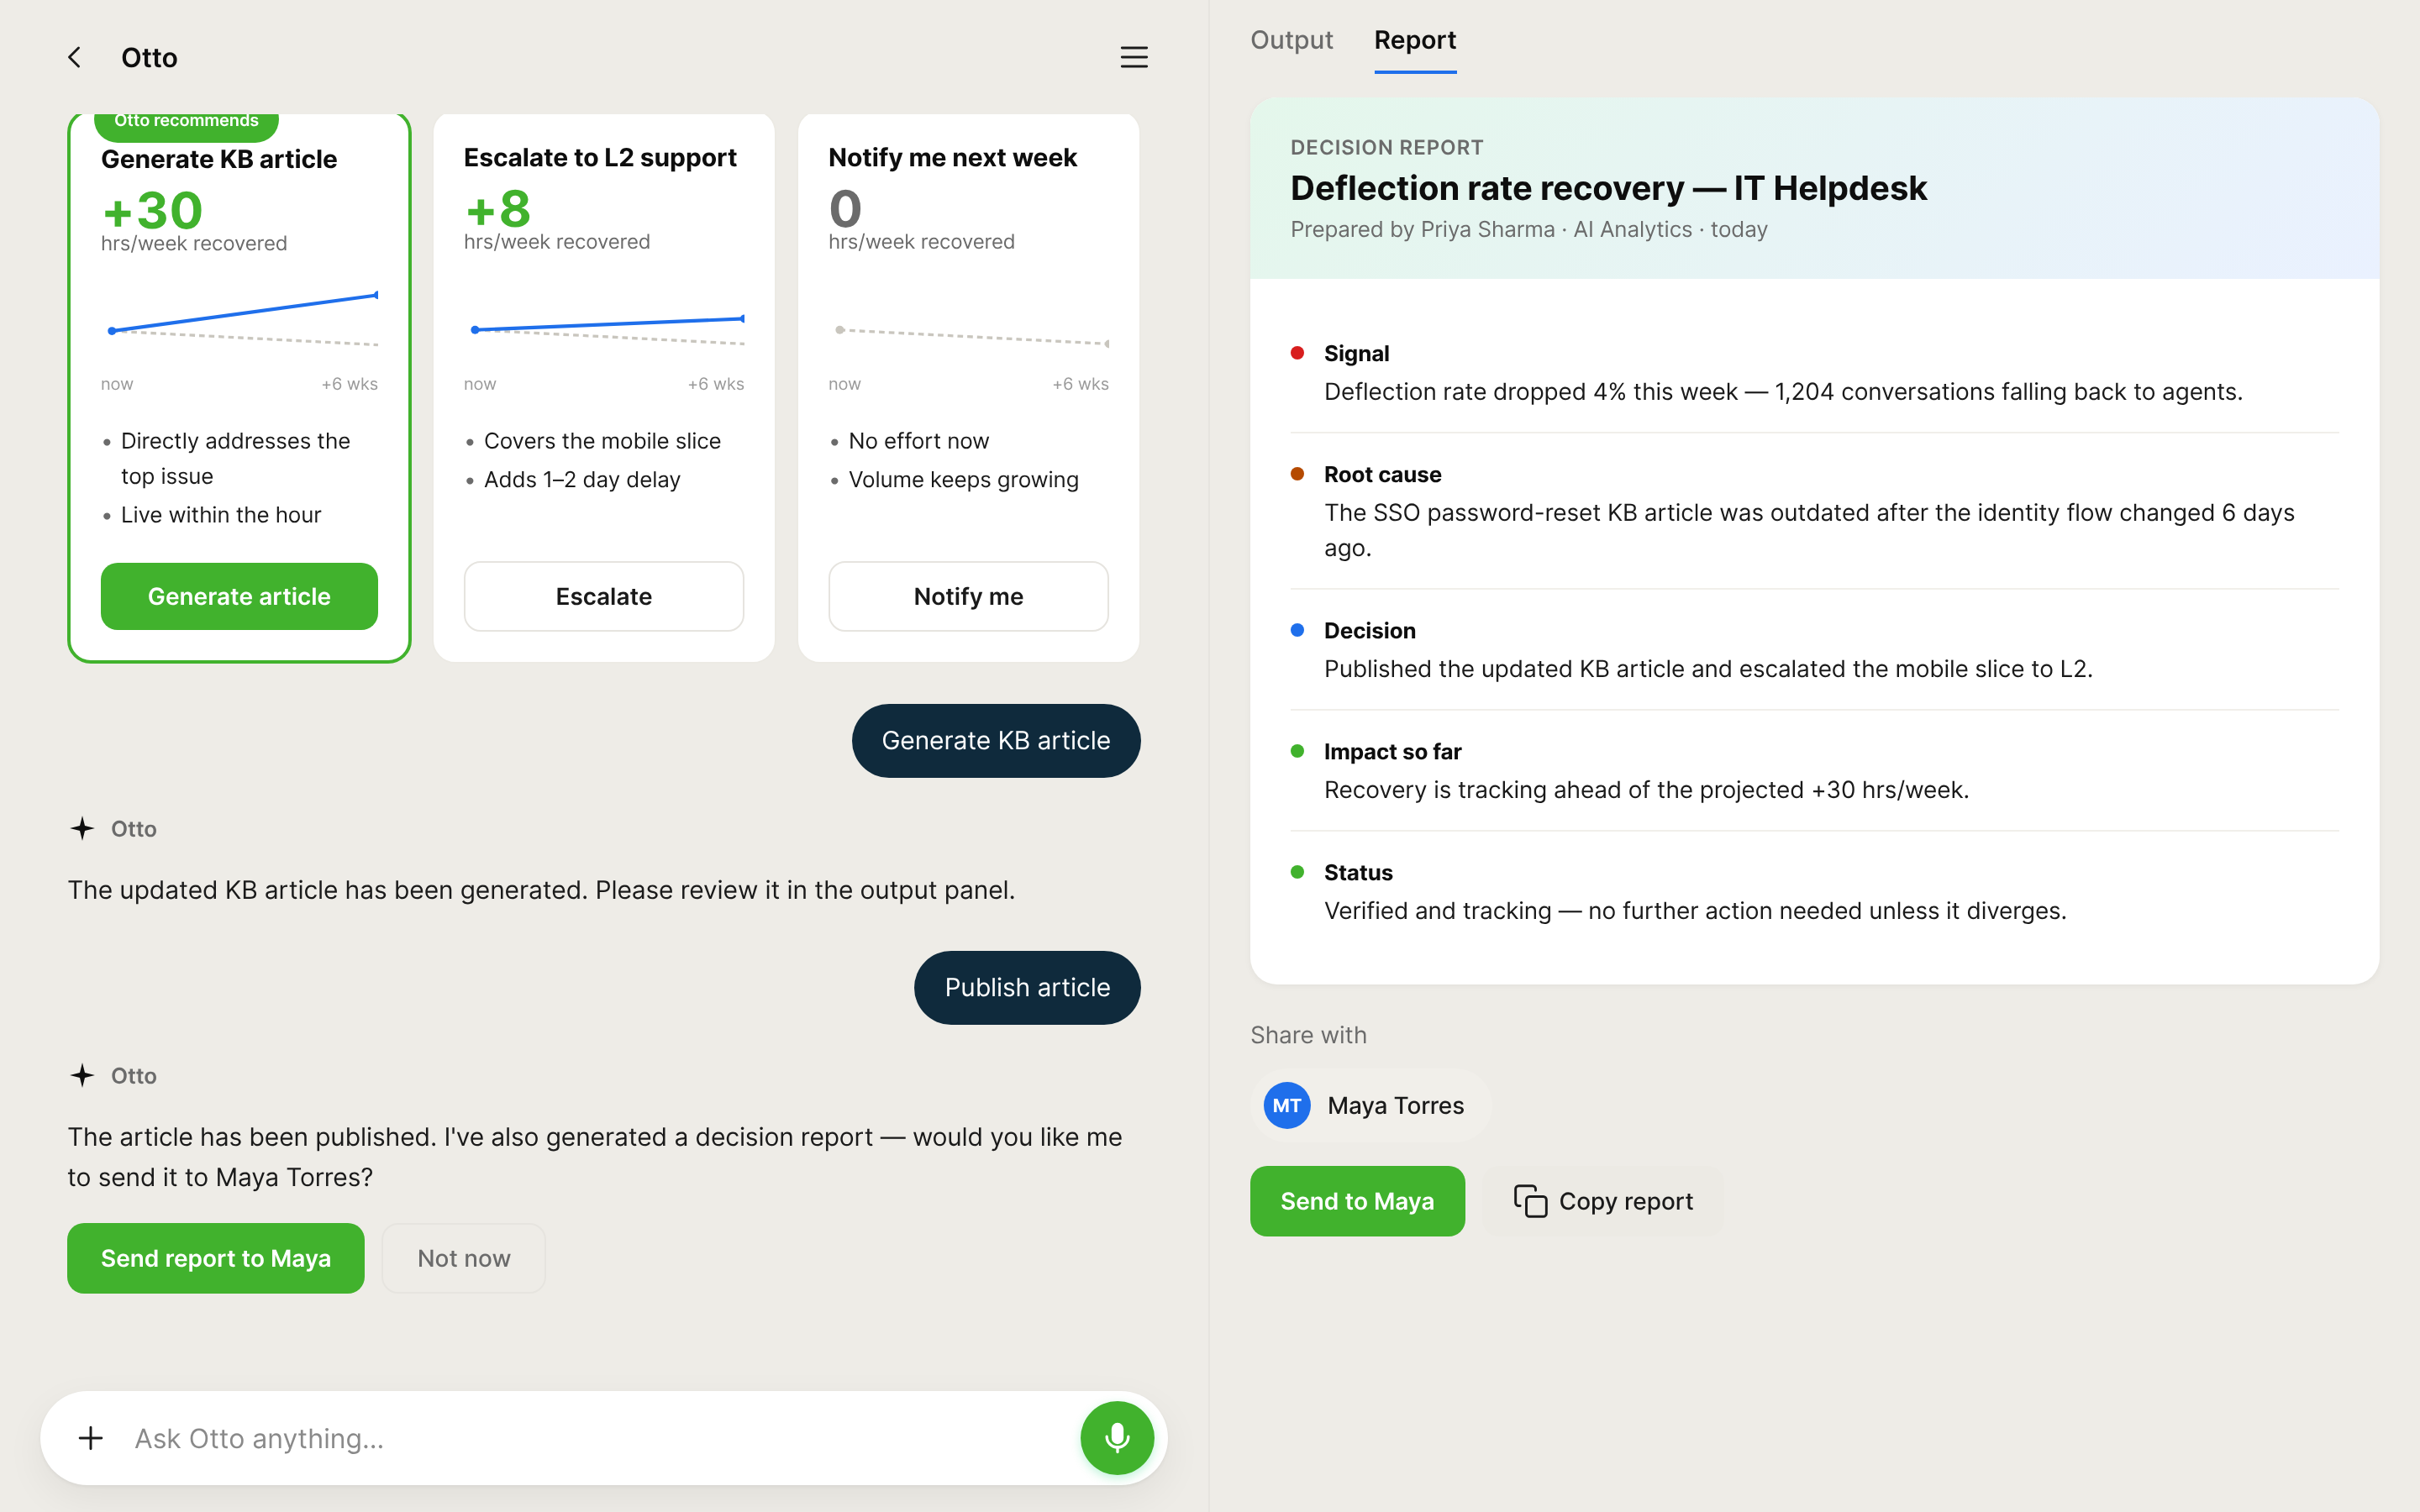
Data in these screens is illustrative.
Design decisions
Why organise by intent, not by data type?
People arrive with a question, like "is adoption growing?", not with a table in mind. Grouping by intent lets one home serve assistants and agents without a separate tool for each.
Why name the definition, not just the number?
An unexplained deflection rate was eroding trust. Showing which definition a metric uses, and letting organisations define their own, makes the number safe to present.
Why does the admin keep the decision?
Research showed people delegate execution, not judgment. Otto ranks, explains and drafts, but the admin accepts, chooses and publishes, and can hand work to others without handing off ownership.
Why compare every action to doing nothing?
A recommendation means little without a baseline. Plotting each option against "no action" makes the cost of waiting visible, so deferring becomes a deliberate choice.
Where it stands
What's still open
- What makes an insight actionable? The bar is different for an admin, a practitioner and a leader.
- How much should Otto explain as you go deeper? The deeper someone drills, the more context each chart should give about what it shows right now.
- How do we measure success? Decisions made and verified matter more than dashboards viewed, and the metrics need to reflect that.